Abstract
Research Article
Evaluating cortical bone porosity using Hr-Pqct
Rique AM, Madeira M, Luis L, Fleius MLde F, Paranhos NF and Lima I*
Published: 27 August, 2019 | Volume 3 - Issue 1 | Pages: 008-013
This work aims to evaluate cortical porosity through a high-resolution peripheral quantitative micro-tomography in a group of 47 patients. All patients, in vivo, were subjected to the medical care protocol of the University Hospital Clementino Fraga, 020-213. Patients were women aged from 37 to 82 years old, who did not present fractures in their lower and upper limbs, all of them showing good health. During screening, they were required to have normal BMD (as determined by DXA; T-score ≥ 1.0) and no low-trauma fractures history. The exclusion criteria for all the individuals enrolled in this control study include, for example, alcoholism, chronic drug use, and chronic gastrointestinal disease. Male patients ranging from 42 to 79 years old presented the same health issues as women group. Results showed an increase in the amount of pores on the cortical bone of the evaluated patients over time; however, this increase was also observed in pore diameter, as well as a decrease in the border between the cortical and trabecular bone, indicating a deterioration in cortical bone quality over the years.
Read Full Article HTML DOI: 10.29328/journal.aceo.1001006 Cite this Article Read Full Article PDF
Keywords:
X-ray; Microtomography; Cortical Porosity; Osteoporosis
References
- Verron E, Gauthier O, Janvier P, Pilet P, Lesoeur J. In vivo bone augmentation in an osteoporotic environment using bisphosphonate-loaded calcium deficient apatite. Biomaterials. 2010; 31: 7776-7784. PubMed: https://www.ncbi.nlm.nih.gov/pubmed/20643480
- Panattoni GL, D'amelio P, Di Stefano M, Sciolla A, Isaia GC. Densitometric study of developing femur. Calcified Tissue International. 1999; 64: 133-136.
- Klotzbuecher CM, Ross P, Blumberg P, Thomas AA, Marc B. Patients with Prior Fractures Have an Increased Risk of Future Fractures: A Summary of the Literature and Statistical Synthesis. J Bone Miner Res. 2000; 15: 721-739. PubMed: https://www.ncbi.nlm.nih.gov/pubmed/10780864
- Seeman E. Bone quality. Osteoporosis Int. 2003; 14(suppl): 5-7.
- Digirolamo DJ, Kiel DP, Esser KA. Bone and skeletal muscle: neighbors with close ties. J Bone Miner Res. 2013; 28: 1509-1518. PubMed: https://www.ncbi.nlm.nih.gov/pubmed/23630111
- Black DM, Clifford J, Rosen MD. Postmenopausal Osteoporosis. N Engl J Med. 2016; 374: 254-262.
- Lima I, Farias MLF, Percegoni N, Rosenthal D, Assis JT, et al. Micro imaging analysis for osteoporosis assessment. Spectrochimica Acta. 2010; 65: 253-257.
- Marinozzi F, Marinozzi A, Zuppante FBF, Pecci R, Bedini R. Variability of morphometric parameters of human trabecular tissue from coxo-arthritis and osteoporotic samples. Ann Ist Super Sanità. 2012; 48: 19-25. PubMed: https://www.ncbi.nlm.nih.gov/pubmed/22456011
- Brandi ML. Microarchitecture, the key to bone quality. Rheumatology. 2009; 48: iv3–iv8. PubMed: https://www.ncbi.nlm.nih.gov/pubmed/19783591
- Buzug TM. Computed Tomography From Photon Statistics to Modern Cone-Beam CT, Springer, 2008.
- Silva BC, Walker MD, Abraham A, Boutroy S, Zhang C, et al. Trabecular Bone Score Is Associated With Volumetric Bone Density and Microarchitecture as Assessed by Central QCT and HRpQCT in Chinese American and White Women. J Clin Densitom. 2013; 16: 554-561. PubMed: https://www.ncbi.nlm.nih.gov/pubmed/24080513
- Zebaze R, Ghasem-Zadeh A, Mbala A, Seeman E. A new method of segmentation of compact-appearing, transitional and trabecular compartments and quantification of cortical porosity from high resolution peripheral quantitative computed tomographic images. Bone. 2013; 54: 8-20. PubMed: https://www.ncbi.nlm.nih.gov/pubmed/23334082
- Tjong W, Nirody J, Burghardt AJ, Carballido-Gamio J, Kazakiae GJ, et al. Structural analysis of cortical porosity applied to HR-pQCT data. Med Phys 2014; 41: 013701. PubMed: https://www.ncbi.nlm.nih.gov/pubmed/24387533
- Madeira M, Vieira Neto L, De Paula Paranhos Neto F, Lima I, Carvalho De Mendonça LM, et al. Acromegaly Has a Negative Influence on Trabecular Bone, But Not on Cortical Bone, as Assessed by High-Resolution Peripheral Quantitative Computed Tomography, J Clin Endocrinol Metab. 2013; 98: 1734-1741. PubMed: https://www.ncbi.nlm.nih.gov/pubmed/23482608
- Xtreme CT. User’s Guide, SCANCO MEDICAL AG Fabrikweg 2 CH-8306. Bruettisellen Switzerland. 2013.
- Laib A, Hauselmann HJ, Ruegsegger P. In vivo high resolution 3D-QCT of the human forearm. Technol Health Care. 1998; 6: 329-37. PubMed: https://www.ncbi.nlm.nih.gov/pubmed/10100936
- Muller R, Hildebrand T, Hauselmann HJ, Ruegsegger P. In vivo reproducibility of three-dimensional structural properties of noninvasive bone biopsies using 3D-pQCT. J Bone Miner Res. 1996; 11: 1745-1750. PubMed: https://www.ncbi.nlm.nih.gov/pubmed/8915782
- Zerbini CAF, Latorre MRO, Jaime PC, Tanaka T, & Pippa MGB.. Bone mineral density in Brazilian men 50 years and older. Braz J Med Biol Res. 2000; 3: 1429-1435. PubMed: https://www.ncbi.nlm.nih.gov/pubmed/11105094
- Macdonald HM, Nishiyama KK, Kang J, Hanley DA, Boyd SK. Age-related patterns of trabecular and cortical bone loss differ between sexes and skeletal sites: a population-based HR-pQCT study. J Bone Miner Res. 2011; 26: 50-62. PubMed: https://www.ncbi.nlm.nih.gov/pubmed/20593413
- Burghardt AJ, Buie HR, Laib A, Majumdar S, Steven K. Reproducibility of direct quantitative measures of cortical bone microarchitecture of the distal radius and tibia by HR-pQCT. Bone. 2010; 47: 519-528. PubMed: https://www.ncbi.nlm.nih.gov/pubmed/20561906
- Dunsmuir JH. X ray Microtomography. ExxonmMobil Research and Engineering. Co. Annadale NJ. 1990.
- Feldkamp LA, Goldstein SA, Parfitt AM, Jesion G, Kleerekoper M. The direct examination of three-dimensional bone architecture in vitro by computed tomography. J Bone Miner Res. 1989; 4: 3-11. PubMed: https://www.ncbi.nlm.nih.gov/pubmed/2718776
Figures:
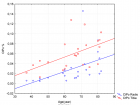
Figure 1
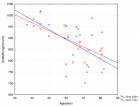
Figure 2
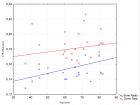
Figure 3
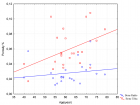
Figure 4
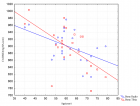
Figure 5
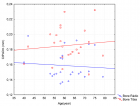
Figure 6
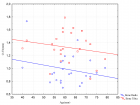
Figure 7
Similar Articles
-
Evaluating cortical bone porosity using Hr-PqctRique AM,Madeira M,Luis L,Fleius MLde F,Paranhos NF,Lima I*. Evaluating cortical bone porosity using Hr-Pqct. . 2019 doi: 10.29328/journal.aceo.1001006; 3: 008-013
-
Preventive treatment in an osteoporotic femoral upper metaphysis-A clinical case: Me Louise V…Yves Cirotteau*. Preventive treatment in an osteoporotic femoral upper metaphysis-A clinical case: Me Louise V…. . 2020 doi: 10.29328/journal.aceo.1001008; 4: 009-012
-
Anterior Laparoscopic Approach Combined with Posterior Approach for Lumbosacral Neurolysis: A Case ReportSheng Wang#,Nan Lu,Yongchuan Li,Xiaohuang Tu*,Aimin Chen*. Anterior Laparoscopic Approach Combined with Posterior Approach for Lumbosacral Neurolysis: A Case Report. . 2024 doi: 10.29328/journal.aceo.1001020; 8: 010-013
Recently Viewed
-
The Need of Wider and Deeper Skin Biopsy in Verrucous Carcinoma of the SoleLuca Damiani*,Giuseppe Argenziano,Andrea Ronchi,Francesca Pagliuca,Emma Carraturo,Vincenzo Piccolo,Gabriella Brancaccio. The Need of Wider and Deeper Skin Biopsy in Verrucous Carcinoma of the Sole. Ann Dermatol Res. 2025: doi: 10.29328/journal.adr.1001036; 9: 005-007
-
Success, Survival and Prognostic Factors in Implant Prosthesis: Experimental StudyEpifania Ettore*, Pietrantonio Maria, Christian Nunziata, Ausiello Pietro. Success, Survival and Prognostic Factors in Implant Prosthesis: Experimental Study. J Oral Health Craniofac Sci. 2023: doi: 10.29328/journal.johcs.1001045; 8: 024-028
-
Awareness and Knowledge of Specialists/Trainers and General Dental Practitioners about Medical-Related Osteonecrosis of the JawsAbdulhamit Taha Koca,Mustafa Bayhan,Yunus Ayberk Demir,Ayse Zeynep Zengin*. Awareness and Knowledge of Specialists/Trainers and General Dental Practitioners about Medical-Related Osteonecrosis of the Jaws. J Oral Health Craniofac Sci. 2024: doi: 10.29328/journal.johcs.1001050; 9: 023-031
-
Advancing Oral Health and Craniofacial Science through Microchip ImplantsShekufeh Shafeie*. Advancing Oral Health and Craniofacial Science through Microchip Implants. J Oral Health Craniofac Sci. 2024: doi: 10.29328/journal.johcs.1001048; 9: 015-018
-
Neurocognitive Effects of Prolonged Virtual Consultation (Zoom Fatigue) in CliniciansSaim Mahmood Khan*,Hassan Saleem,Muskan Zahra,Faiza Saleem,Surraiya Riaz Mahmood Khan. Neurocognitive Effects of Prolonged Virtual Consultation (Zoom Fatigue) in Clinicians. J Community Med Health Solut. 2025: doi: 10.29328/journal.jcmhs.1001063; 6: 080-082
Most Viewed
-
Feasibility study of magnetic sensing for detecting single-neuron action potentialsDenis Tonini,Kai Wu,Renata Saha,Jian-Ping Wang*. Feasibility study of magnetic sensing for detecting single-neuron action potentials. Ann Biomed Sci Eng. 2022 doi: 10.29328/journal.abse.1001018; 6: 019-029
-
Evaluation of In vitro and Ex vivo Models for Studying the Effectiveness of Vaginal Drug Systems in Controlling Microbe Infections: A Systematic ReviewMohammad Hossein Karami*, Majid Abdouss*, Mandana Karami. Evaluation of In vitro and Ex vivo Models for Studying the Effectiveness of Vaginal Drug Systems in Controlling Microbe Infections: A Systematic Review. Clin J Obstet Gynecol. 2023 doi: 10.29328/journal.cjog.1001151; 6: 201-215
-
Causal Link between Human Blood Metabolites and Asthma: An Investigation Using Mendelian RandomizationYong-Qing Zhu, Xiao-Yan Meng, Jing-Hua Yang*. Causal Link between Human Blood Metabolites and Asthma: An Investigation Using Mendelian Randomization. Arch Asthma Allergy Immunol. 2023 doi: 10.29328/journal.aaai.1001032; 7: 012-022
-
An algorithm to safely manage oral food challenge in an office-based setting for children with multiple food allergiesNathalie Cottel,Aïcha Dieme,Véronique Orcel,Yannick Chantran,Mélisande Bourgoin-Heck,Jocelyne Just. An algorithm to safely manage oral food challenge in an office-based setting for children with multiple food allergies. Arch Asthma Allergy Immunol. 2021 doi: 10.29328/journal.aaai.1001027; 5: 030-037
-
Near-miss Women Causes and Prevalence in Alobied Maternity HospitalAyat Eltigani, Taha Umbeli Ahmed, Awadalla Abdelwahid Suliman*, Abdelsalam SalahEldin, Isra Siralkatim, Hajar Suliman. Near-miss Women Causes and Prevalence in Alobied Maternity Hospital. Clin J Obstet Gynecol. 2023 doi: 10.29328/journal.cjog.1001149; 6: 185-192

If you are already a member of our network and need to keep track of any developments regarding a question you have already submitted, click "take me to my Query."


